ERPNext Performance Checklist: Practical Engineering Guide
A practical performance engineering checklist for ERPNext: measurement design, representative workloads, profiling, caching, I/O, concurrency, CI checks, and anti-patterns.
Executive answer
This checklist gives engineering teams a pragmatic, repeatable approach to measure and improve ERPNext performance across application, database, and deployment layers. It covers how to design measurements, build representative workloads, profile Python and DB hotspots, apply effective caching, reason about I/O and concurrency, guard boundaries between database and network tiers, and add CI regression checks. The guidance is implementation-focused and avoids fabricated benchmarks; use it to get measurable signal before you optimize.
ERPNext is an open-source ERP implemented using the Frappe stack; the repository shows Python as the primary language and documents MariaDB as an example dependency for local installs. Where we infer architecture from readme text or repository structure, those inferences are explicitly labeled. For repository facts and the latest release referenced here see the official project pages: the ERPNext repository and the v16.34.1 release are cited below for verification. Data retrieval/generation date: 2026-09-06.
What this guide covers
- Measurement design: goals, metrics, and instrumentation points
- Representative workloads and data sets for ERP scenarios
- Profiling (Python, SQL, network) and how to interpret results
- Caching strategies and where to apply them safely
- I/O and concurrency practical rules for ERP workloads
- Database/network boundaries and common anti-patterns
- CI checks and preventing misleading benchmark patterns
- Decision checklist and action checklist for an improvement cycle
Baseline: facts and architectural notes
- ERPNext repository facts (sourced): the canonical repo is available on GitHub at the ERPNext project page and lists Python as the primary language; the repository shows Docker and MariaDB references in its README and provides release information for v16.34.1 (published 2026-09-02). See the sources section for links and the retrieval date above for freshness. ERPNext canonical repository | ERPNext latest release
- Inferred architecture (labelled): From the README snippets in the repository, ERPNext is delivered on the Frappe Framework and the project provides Docker examples and references MariaDB as a supported DB for local installs. These are inferences drawn from repository documentation and not independent runtime measurements.
Measurement design: goals, metrics, instrumentation
Design measurements around user journeys, not endpoints. For ERP systems focus on these journey classes:
- Interactive UI journeys: login, open a form (Invoice, Sales Order), save/submit a document, open reports.
- Batch/automation jobs: scheduled reports, background workers (email, notifications), import/export jobs.
- Integration/API flows: third-party sync, REST API CRUD for core objects.
Key metrics to collect (instrument everywhere):
- Latency percentiles (p50, p90, p95, p99) per journey
- Error rate per journey
- Throughput (requests/sec) for API and background job rates
- Resource usage: CPU, memory, disk I/O, network bytes
- Database metrics: query execution times, slow query counts, connections
- Queue/backlog lengths for worker systems
Instrumentation guidance:
- Add timing at journey boundaries (enter/exit) and at key phases (render, DB, external call). Use structured tracing or request logs with correlation IDs.
- Capture DB-level timings with the DB's slow-query log or query-level instrumentation (EXPLAIN for suspect queries). MariaDB is referenced as an example DB in the repo README — make sure DB logs are enabled in production-like environments.
- For background workers capture job run times and failure counts.
Representative workloads and data sets
Representative workloads are the single most important input to meaningful performance work.
Workload design steps:
- Inventory business-critical journeys and their typical concurrency from logs.
- Create synthetic users that follow realistic think times, navigation patterns, and data dependencies (e.g., create customer -> create invoice -> submit).
- Use production-like data volumes for cardinality-sensitive operations (account charts, large BOMs, full inventory). If production data cannot be used, synthesize data with similar distributions of records per table and field cardinalities.
- Include long-running operations: complex reports, bulk imports, and scheduled jobs. These often compete for DB resources and expose contention.
Representative data image (usage distribution, sample chart):
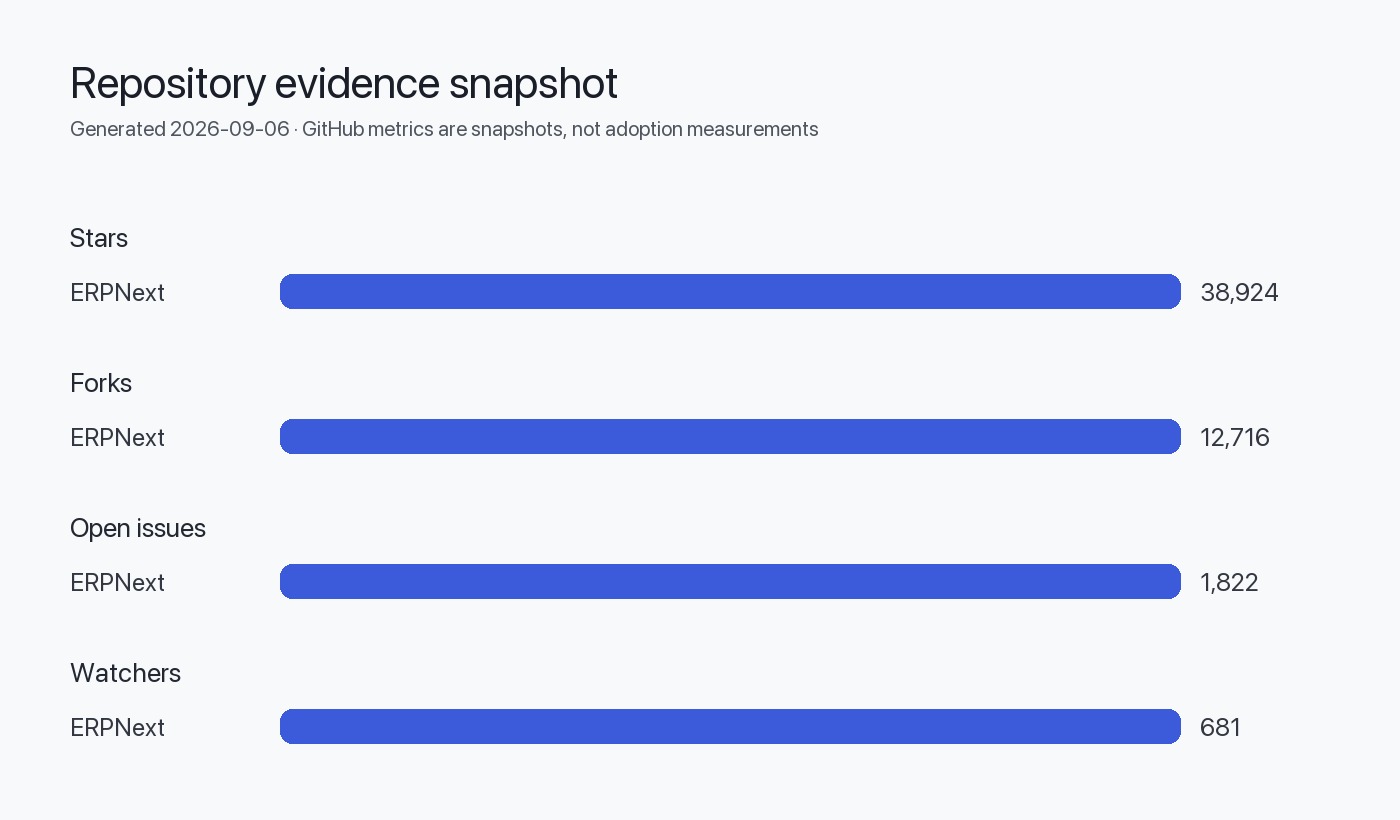
Table: Recommended workload types and why they matter
| Workload type | Why include it |
|---|---|
| Interactive CRUD (forms) | High-frequency UI operations that determine perceived latency |
| Report generation | Often heavy DB reads and aggregations; can surface inefficient queries |
| Bulk imports/exports | Reveals locking, transaction sizing, commit frequency impacts |
| Background jobs | Showcases queueing, worker parallelism, and retry storms |
| API integrations | Measures network latency and serialization overhead |
Table: Data characteristics to mirror from production
| Characteristic | Impact if not represented |
|---|---|
| Table cardinality (rows per table) | Query plans and index effectiveness differ at scale |
| Field cardinality (distinct values) | Affects index selectivity and optimizer decisions |
| Historical depth (years of data) | Affects archive vs active partitioning needs |
| Concurrency mix (read/write ratio) | Determines isolation and lock contention behaviour |
Profiling: Python, SQL, and network
Profiling strategy is layered: start top-down (user journey), then narrow to service and DB.
- Journey-level timing: find which journeys and phases contribute most to latency.
- Application-level profiling: capture CPU and call-stack behavior for slow requests using a sampling profiler (low-overhead) or statistical tracing. Instrument background workers too.
- Database profiling: extract slow queries and run EXPLAIN/EXPLAIN ANALYZE against test data. Collect execution plans to identify missing indexes, heavy scans, or poor join order.
- Network/serialization: for integrations, measure network RTT and serialization time for payloads (JSON size, number of fields).
Profiling notes specific to ERPNext environment (inferred): since ERPNext is Python-based (repository list), expect Python-level hotspots in ORM layers, business logic, or template rendering. Confirm by profiling before changing code.
Caching and stateful optimizations
Where to apply caching safely:
- Read-heavy reference data: company config, chart of accounts, master records. Cache at application memory or a shared cache depending on process model.
- Computed view fragments: heavy report fragments that are reused frequently and invalidated when source data changes.
- API responses for integrations that tolerate staleness (with TTLs and cache invalidation strategies).
Safe caching rules for ERP systems:
- Prefer cache invalidation triggered by the same write paths used to mutate data (post-commit hooks, event emitters). Avoid long blind TTLs for mutable records.
- Keep security in mind: per-tenant or per-user caches must not leak private data across tenants/users.
- Measure cache hit rates and how those translate to server and DB load reductions.
Caching tradeoffs table
| Cache type | Best for | Risk / mitigation |
|---|---|---|
| In-process cache | Single-process low-latency lookups | Not shared across processes; use for read-mostly small objects |
| Shared cache (e.g., Redis) | Cross-process, cross-container caching | Requires invalidation; monitor evictions and memory |
| CDN for static assets | UI resource delivery | Use cache-busting for releases |
Note: The repository README references Docker and managed hosting options, but specific cache components are not enumerated there; any cache choice must be validated against your deployment topology.
I/O, concurrency, and resource contention
Rules of thumb (qualitative):
- Separate interactive latency from batch throughput: do not run heavy report generations on the same workers that handle UI unless you can isolate resources.
- Database connections are finite: measure peak concurrent connections and tune pool sizes; aggressive parallelism without pool tuning will cause queueing at the DB.
- Transaction sizing matters: large transactions that update many rows increase lock retention and can block other operations. Break bulk work into chunks and commit between chunks when safe.
- Disk I/O patterns: random writes and checkpointing will affect DB latency; use monitoring to correlate disk I/O and query latencies.
Concurrency anti-patterns table
| Anti-pattern | Why it hurts |
|---|---|
| Bulk operation in single transaction | Locks many rows and increases rollback costs |
| One DB connection per thread without pooling | Connection churn and resource exhaustion |
| Synchronous external calls in UI request path | Amplifies latency and amplifies failures |
Database and network boundaries: where to draw the line
- Treat the DB as authoritative for consistency but not for complex business logic that can be cached or precomputed. Push pure-aggregation read loads to read replicas or pre-aggregated tables when necessary.
- Separate cross-service network calls from the critical path of UI responses. If an external system must be consulted, consider asynchronous patterns or fallback data to preserve responsiveness.
- For multi-tenant deployments, consider per-tenant resource isolation: separate DBs, schema-level tenancy, or resource quotas depending on scale and isolation needs.
CI and regression checks
Add performance assertions to CI with care:
- Keep CI workloads small and deterministic: micro-benchmarks that exercise isolated functions or queries run in PRs; avoid whole-system load tests on PRs.
- Maintain a performance lab or staging environment for reproducible integration benchmarks. Use job templates to run nightly or on-demand long-running workloads with consistent data snapshots.
- Capture baselines: commit a known set of metrics (e.g., median time for core operations) and require that PRs include performance diffs for high-risk changes.
- Protect against noise: use statistical significance testing or change thresholds (e.g., require >10% change over baseline plus p-value) to avoid false positives.
CI checks examples (no numeric thresholds provided):
- Unit-level: function-level microbenchmarks for hot-path utilities.
- Integration-level: script that executes login->open->save journey with fixed dataset and records p95 latency.
- DB-level: regression check that ensures important queries still use indexed paths (EXPLAIN plan contains expected index).
Misleading benchmark patterns to avoid
- Using tiny datasets: query plans and cache behavior differ drastically at production scale.
- Measuring only averages: averages hide tail latencies; use percentiles for SLAs.
- Running benchmarks on noisy shared infrastructure without isolating resources: results will be non-reproducible.
- Cherry-picking favorable test cases that ignore failure modes (e.g., only successful fast-paths). Include error and retry behavior.
Practical optimization workflow (decision checklist)
- Observe: instrumented metrics show a customer-visible regression or capacity need.
- Reproduce: run representative workload against a baseline environment with production-like data.
- Profile: capture application and DB traces under the reproducer workload.
- Diagnose: prioritize fixes by impact and implementation risk (prefer config/infra first, code changes second).
- Fix incrementally: small, measurable changes with A/B or canary rollout where possible.
- Validate: rerun workload, compare against baseline, and inspect downstream effects (cache, DB load, error rate).
- Automate: add a regression check to CI or the nightly lab if the change needs long-term guardrails.
Action checklist (operational steps)
Mermaid: example data flow for measurement and mitigation
flowchart LR
  UI[User Journey] -->|HTTP| App[ERPNext App Server]
  App -->|ORM/SQL| DB[MariaDB (authoritative)]
  App -->|async| Worker[Background Worker]
  App -->|cache read/write| Cache[Shared Cache]
  DB -->|replication| Replica[Read Replica]
  Worker -->|job queue| Queue[(Queue)]
  subgraph Observability
    App -->|tracing| Trace[Tracing/Logs]
    DB -->|metrics| DBM[DB Metrics]
    Cache -->|metrics| CM[Cache Metrics]
  end
Evidence, assumptions, and limitations
- ERPNext canonical repository (GitHub) — referenced for codebase language, README excerpts, and Docker/MariaDB mentions. ERPNext canonical repository
- ERPNext release v16.34.1 release notes (GitHub) — used to verify active maintenance and recent changes. ERPNext latest release
Assumptions and explicit labels:
- Inferred architecture: statements that ERPNext runs on the Frappe Framework and uses MariaDB for local installs are inferences based on the repository README text and are labelled accordingly in this article. These are not runtime audits.
- No fabricated performance measurements: this article deliberately avoids numerical performance claims because doing so without controlled tests would be misleading.
- Toolchain neutrality: the guide recommends methodologies and categories of tools (profilers, DB EXPLAIN, tracing) rather than specific vendor lock-in choices.
Limitations:
- The repository and release pages cited provide documentation and code; they do not include exhaustive details on deployment topologies, managed hosting internals, or default cache components. Implementers must validate recommendations against their actual deployment and platform choices.
- Because ERPNext deployments vary (single-tenant, multi-tenant, cloud-managed, self-hosted Docker), the advice is intentionally prescriptive in process and principles and non-prescriptive about exact tuning values.
Sources
- ERPNext canonical repository: https://github.com/frappe/erpnext
- ERPNext latest GitHub release (v16.34.1): https://github.com/frappe/erpnext/releases/tag/v16.34.1
FAQ
How do I pick which user journeys to instrument first?
Start with the journeys that are most visible to users and carry business value: login, create/submit invoice, open critical reports. Use production access logs to identify high-frequency or high-impact flows.
Should I profile in production or staging?
Do lightweight, sampled profiling in production for real traffic signal. For heavyweight profiling and reproducible experiments use a staging/lab environment with a production-like dataset.
Is caching always safe for master records like customers or accounts?
Caching is useful for read-heavy master data but requires proper invalidation: tie invalidation to write paths so updated records don’t remain stale past your acceptable TTL.
How do I avoid noisy CI false positives for performance tests?
Keep CI micro-benchmarks small and deterministic. Reserve full-system load tests for an isolated performance lab; use statistical tests or threshold windows to reduce flakiness in CI alerts.
What should I look for first in a slow request?
Break the request into phases (webserver, app CPU, DB, external calls). Measure each phase’s duration and focus on the largest contributor. Often coarse configuration fixes (pools, timeouts) are cheaper than code changes.
When is it time to add a read replica or vertical scaling?
After you’ve proven that read load is causing DB CPU or I/O saturation and you’ve exhausted cheaper measures (indexes, query improvements, caching), consider read replicas for read scalablity or vertical scaling for write throughput. Validate with load tests.
How often should I re-baseline performance tests?
Re-baseline when you change major infra components, upgrade database versions, or after significant schema or query changes. Store baselines with timestamps and commit SHAs for reproducibility.